Savanna, GA Heat Map
SpotCrime has the ability to create heat maps of shootings for a specific city. The heat map will show more 'heat' where ever a shooting has occurred. If there are multiple shootings in an area, the 'heat' will be more intense.


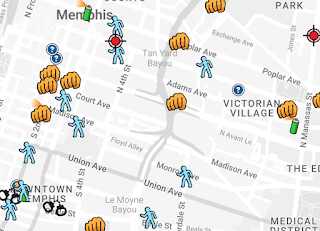
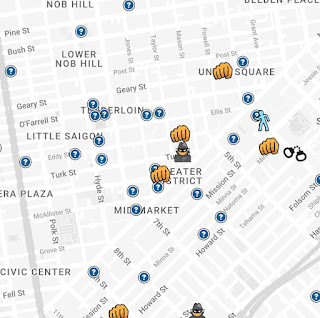
Check out the SpotCrime heat map of Savannah, GA shootings.

Now, check out the Savannah heat map with push pins where the shootings occurred.

The Savannah areas with a lot of shootings are 'hotter' or more yellow than the other areas.
With this map, it is easy to see where most of the shootings occur in Savannah. This is pretty cool and very informing. It looks like most fire power is released just south of the Savannah Historic District.
Want more information on what occurs in your Savannah area? Check out SpotCrime or MyLocalCrime. Sign up for your local Savannah crime alerts. Stay aware, stay safe!

Comments