Posts

Montreal Crime Mapped on SpotCrime

Image
Montreal Burglaries March 24-31 SpotCrime is now mapping Montreal burglary data! Right now, the city has only published data up to March of this year and is working on releasing more crime types so we are keeping an eye on updates for you. In addition to releasing crime data, Montreal will begin testing body cameras on police officers this year. Montreal is a city located in the Quebec province of Canada. It’s the second largest city in Canada (after Toronto ) and the largest city in Quebec with a population over 1.6 million. French is the city’s official language. A cool thing about Montreal crime data is SpotCrime is now mapping crime in English and French! It’s promising to see more agencies across the world becoming more open and transparent with crime data. SpotCrime also maps crime data in the UK , other parts of Canada, and parts of Australia. Want crime mapped in your country? Let us know !

O CANADA: Your Crime Maps Need Some Work.

Image
Good news: we are seeing more Canadian agencies make an attempt to move toward increased transparency within their police agencies. A few Canadian cities have released their own versions of crime maps.  The bad news is the maps they are creating could be way better.  Three ways Canada can make better crime maps: Open (and machine readable) : To start, each map should come with some sort of open, machine readable data feed. This will allow the data to be easily consumed by anyone. Only a few of the maps do this currently. Date : The data included on the maps could be better. One city doesn’t give a specific date, just a range. Another city only gives the month. Some cities provide data months behind. Location : Some sort of address should be included. We’ve found typically in Canada the icons/addresses are anonymized and sometimes moved blocks away. Anonymizing sensitive isn’t a bad thing and is needed in order to help protect victims. Moving crime incidents blocks a...

UCR and NIBRS: Not Enough to Keep Communities Safe

Image
Should you use year old economic data to determine the current economic stability or the unemployment rate? Would you wait a year after receiving medical information to make a decision on how to proceed with a potentially life threatening procedure? Do sports teams only look at statistics at the end of the season? No. So, why do we happily wait a year for access and the ability to analyze crime rates with UCR (Unifrom Crime Reporting) and NIBRS (National Incident Based Reporting System) reporting? Although well intentioned, it is our belief that UCR and NIBRS should not be data communities ask for and utilize when trying to figure how to assess crime in their neighborhood.  *Please note we are not arguing for cessation of UCR and NIBRS. If these reports have been around for so long, then they must be useful. Right? UCR and NIBRS Fall Short Timeliness: One of the problems with UCR and NIBRS reporting from the community perspective is timeliness. The reports are ...

Mapping Crime in King County, WA

Image
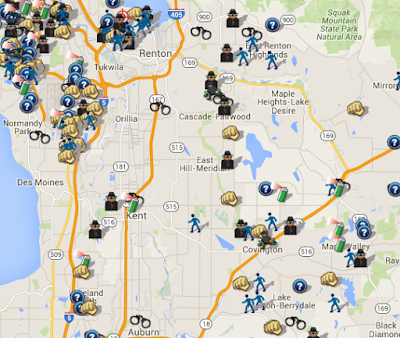
Crime in King County, WA SpotCrime is now mapping crime in King County, WA ! King County is the most populated county in Washington state with a population around 2 million. Cities like Seattle, Bellevue, Renton, Issaquah, Kirkland, and Redmond are all located within King County. King County Sheriff's Office  services over half a million people in unincorporated areas and 12 contract cities. KCSO also services areas like Boeing Field (King County International Airport), Metro Transit, and Muckleshoot Tribe. King County Sheriff's Office is not participating in any open data initiatives like neighboring agencies Seattle and Bellevue. If you'd like to see King County participate in open data, contact them and let them know ! To see crime data from all surrounding agencies ( Seattle , Bellevue , King County , Snohomish County , Pierce County , Tacoma , etc) on one map, navigate to the front page of SpotCrime.com . Don't want to see any ads? SpotCrime.info is ...

Introducing SpotSpec: Crime Location Analysis Tool by SpotCrime

Image
We’re happy to announce the newest addition to the SpotCrime family - SpotSpec.com ! SpotSpec, powered by SpotCrime , takes an in-depth look at crime around specific places and generates crime rankings and reports for locations like schools, restaurants, and hotels. The ultimate goal of SpotSpec is to provide a useful tool that creates awareness with the public, highlights the importance of police data transparency, and increases community trust with police agencies. For now, we have rolled it out exclusively for Baltimore City Schools , Baltimore County schools , and Baltimore City restaurants , but hope to be able to add more areas and locations soon. Each location receives:  A calculated SpotCrime SpotSpec score A ranking against other similar locations And an individually tailored Crime Spec report We hope you find this new tool useful and interesting. Go out, explore, be aware, and be safe. Head on over to www.SpotSpec.com and let...

Don’t Let Your Police Department Upgrade Out of Transparency

Image
Updates have been made to the SpotCrime ‘Live’ Crime Data Transparency Ranking list. Only 1 city was upgraded to a 2 ranking - Baltimore. They added a calls for service and arrest data feeds after the Freddie Grey protests. 5 cities were downgraded. The recurring reason for the decrease in transparency across the country? Police system ‘upgrades’. The new year has brought dozens of RMS/CAD/database upgrades to police departments nationwide. It’s great to see agencies embracing new technology, however, these new upgrades are knocking public access to crime information offline. Boston, MA - 2 to a 0  BPD is no longer updating the open data feed due to RMS upgrade . No timeline has been given as to when the feed will be available again. Phoenix, AZ - 2 to a 1   The Phoenix  RMS upgrade knocked a weekly public file offline and dramatically decreased the the timeliness and quality of the data. St. Louis County, MO - 2 to a 0   St....

CompStat 2.0: Police Data Transparency and Community Trust

Image
Two agencies, The Vera Institute of Justice in accordance with The Police Foundation and the NYPD in accordance with Microsoft, have recently announced their own separate development, test, and implementation of a model for law enforcement agencies aiming to upgrade current CompStat processes. Both The Vera Institute and NYPD are calling their new versions of CompStat ‘CompStat 2.0’. The Vera Institute has a history of work on public safety related issues like police management practices, police-community relations, misconduct, and policing in democratic societies worldwide. And, the Vera Institute worked with the NYPD in the past on development of projects including The Manhattan Summons project as well as the development and implementation of the original CompStat launched by NYPD Commissioner Bill Bratton in the early 90’s. The New CompStat 2.0 (two different versions) Unfortunately, we weren’t able to receive any information from NYPD PIO office on their version o...