A Tale of Two Canadian Crime Maps
In the past month, two Canadian cities introduced online public facing crime maps.
Early October, Toronto police sent out a press release on their new public facing crime mapping system, and recently, Ridge Meadows RCMP put out two maps for Maple Ridge and Pitt Meadows.
Here’s the link to the Toronto Police map page:
http://maps.torontopolice.on.ca/
Powered by Esri, the Toronto map is actually three maps: major crimes (MCI), shootings, and annual data sets for the MCI. Toronto PD gets a plus here because it is the only agency, I know, that has been breaking out shooting data for the public. My understanding is that this was done as a result of the increase in shootings in the 80’s a result of gang warfare. Regardless, it is unique.
That is the last compliment I’ll pay to these burdensome and nearly useless maps.
Here’s a link to the disclaimer language that shows up as a pop up on the map:
http://bit.ly/1k4JNaT
This is typical disclaimer language taking no responsibility of the data. 'Data may change, do not hold us accountable' BS that you’d find on most websites, including SpotCrime.
And tucked in towards the end of the disclaimer - “Any use of the information for commercial purposes is strictly prohibited.” Often the motivation for this type of language is to stop marketing companies using the data, but how does this affect the press who report on crimes every day and have ads next to their stories? The problems with these type of restrictions is that they can be arbitrarily enforced. Is the local news station CP24 violating the commercial purposes clause here:
http://www.cp24.com/news/major-crime-indicators-mci
http://www.cp24.com/news/major-crime-indicators-mci
Some police departments have suggested that they don’t want home alarm companies to have the data, but often the vendor companies that house the databases, sell the data and aggregated information to industry including home alarm companies. The net effect of this type of language just adds limits to the public and the press while all other parties get better information and unfettered access. Thanks Toronto.
And it gets better.
Here are two screen shots of the first MCI map.


Where’s the crime data? Turns out that if you zoom in to an useful level, the data disappears. What’s the best way to reduce crime in Toronto? Just zoom into your neighborhood and the crime goes away - magic!
Where’s the crime data? Turns out that if you zoom in to an useful level, the data disappears. What’s the best way to reduce crime in Toronto? Just zoom into your neighborhood and the crime goes away - magic!
Notice that the zoom level provided on the address is at least four clicks beyond where crime data is shown. So the zoom level on the map for an address search shows no crime unless you zoom out four clicks.
Thinking this was a bug, we reached out to let them know the zoom feature was broken. Unfortunately, we learned this was being done on purpose. See the email here: http://bit.ly/1ORSgeB
We’ll skip over the shooting map. It has the same wonderful functionality of the MCI map.
On to the Annual Datasets for the MCI. Here’s a screenshot:
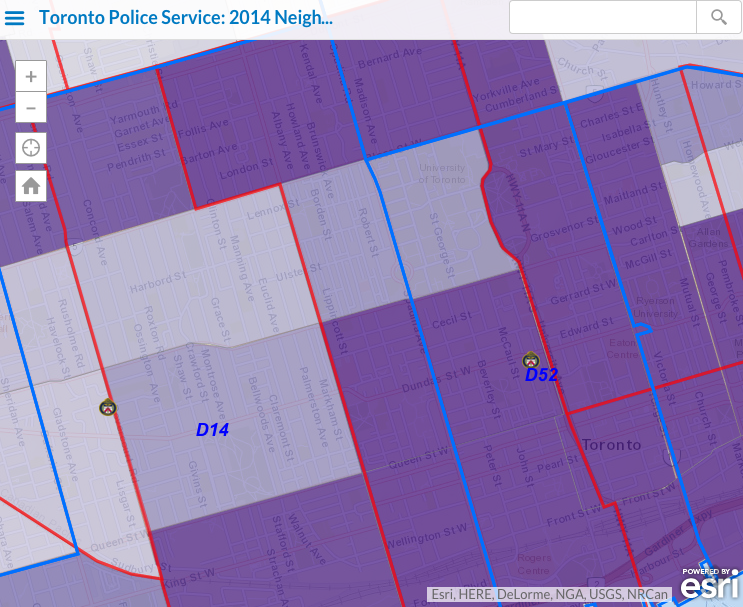
Notice the beautiful shades of purple, violet, and I think some periwinkle. Ostensibly, the darker shades mean more crime. The sections are divided by police boundaries and then by city wards (red lines). Notice how the crime rate can jump significantly from top left to bottom right based on police divisional boundary. Obviously, it is apparent as you move to the bottom right of this map the crime increases, but the discrete nature of the boundaries tell us little.
Boundary crime maps are useful for political arguments. ‘My ward has less crime than yours’ stuff. But as a practical useful public purpose, I would argue they have little actionable value.
The Esri system being used on these maps are robust with many tools and rich graphics. But for a simple query about crime around a person’s home, these maps provide little information.
It is, however, likely they were produced at considerable expense in comparison to the next maps. My guess is that they cost 1,000 times more than the next maps.
On to the Ridge Meadows RCMP maps. Here is the link:
First off, where’s the disclaimer? It’s missing. There’s nothing there denying accountability or limiting how the data is used. It almost seems like it is truly open data.
This Esri map is much less robust than the Toronto version. There are no layers to click on. No lengthy text describing how the map operates. After you get past the interesting pinks and neon greens, the map just works.
The icons are clear, and the crime descriptions when click on provide useful information of type, time and approximate address - not a random address as in the Toronto map.

Notice how far I have zoomed in on the above map. You can see the blocks and the crimes. The icons don’t disappear like Toronto’s map.
And what’s this? The map has an export feature, allowing anyone to export the data into multiple formats. Unbelievable! This police agency must truly trust its public and the press. They must better understand the concept of open data.
Pure conjecture here. But, I am convinced the expense of this map was , times less than Toronto’s mapping system, and it is 1,000 times more useful to the public. It is also likely that RCMP could share this technology with the Toronto Police at no expense.
How do two police departments produce two entirely different public facing crime mapping systems? There may be many answers. One I’ve found to be true is that the size and complexity of a department can often produce a public crime map with proportionate cost and complexity for the public. In reality, we just need the data and not some randomly assigned dots.
Will companies commercialize the crime data if it is open? Yes. It is likely it is being commercialized now - behind every agency’s back or with consent - by the mapping vendor. When done with consent data sales are justified as useful to industry, but somehow harmful to the public. Wal-Mart needs the detailed data to determine where to build a store, but why is this same information detrimental in the public’s hands?
Why have we taken time to point out the problems of the Toronto map and give kudos to the Ridge Meadows RCMP? First we recognize and treat with deference anyone who works in law enforcement. And we realize that many people with good intentions many have worked on the Toronto map. However, we feel that the utility of the Toronto maps were never fully analyzed or that any fact based decision making went into the process. We find it hard to believe that any member of the public are using this maps because the information is too diluted or too randomized to be of use.
We are in the public crime mapping business. It is in our interest to have data open and available to everyone. We find it shameful that in 2015 that a department with sufficient resources like Toronto produces a crime map that is deliberately hampered and inaccessible. The new Toronto crime map has set the bar to a new low.
It is a move forward that the Toronto PD mentions open data:

Unfortunately, there is no open data to be found on the website.
Unfortunately, there is no open data to be found on the website.
We hope that this is a first iteration for Toronto, and they move towards a more open and public trusting website like Ridge Meadows RCMP.


Comments