The Internet can’t seem to come to an agreement on the 10 Most Dangerous cities in the US.
There are quite a few websites ranking US cities as most dangerous, but not all sites list the same cities. This may be because of what data was used - some sites only ranked cities with a specific population, some looked at only violent crime, some overall crime. Sites that have a 10 most dangerous list include
24/7 Wallstreet,
Forbes,
World Atlas,
Safewise,
The Active Times,
IBTimes, and
NeighborhoodScout.
We decided to compare all of those lists to get you a list of 10 Most Dangerous Cities in the US (an aggregate version).
To our surprise,
Chicago, with the amount of gun violence the city faces daily, was not found on a single list. We didn’t find New York City listed either, however, NYPD has been showing a decline in crime in NYC since the 90s. In the past New Orleans has ranked high, however, they were only found listed as dangerous once.
The good news - currently in the past month, crime is only up in 2 of the cities on our list (Memphis and Milwaukee). Even better news?
Crime is down nationwide.
Without further delay here it is - a list of the most dangerous cities in America with some SpotCrime analysis of crime for this month:
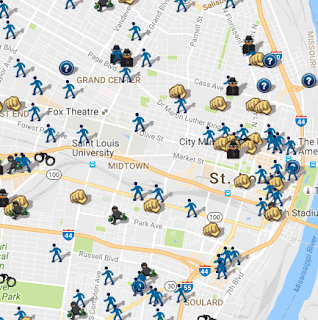
1. St Louis, MO
According to the reports SpotCrime receives from local police agencies,
crime overall in St. Louis, Missouri is currently down by 92% when compared to the previous month.
Property crime such as theft, vandalism, and burglary is down in St. Louis, Missouri. Fortunately, property crime and overall crime have both decreased this month, with property crime decreasing by 93% when compared to the previous month.
Violent crime including shootings, assaults, and robberies is down in St. Louis, Missouri. Fortunately, violent crime and overall crime have both decreased this month, with violent crime decreasing by 91% when compared to the previous month.
2. Detroit, MI
According to the reports SpotCrime receives from local police agencies,
crime overall in Detroit, Michigan is currently down by 31% when compared to the previous month.
Property crime such as theft, vandalism, and burglary is down in Detroit, Michigan. Fortunately, property crime and overall crime have both decreased this month, with property crime decreasing by 20% when compared to the previous month.
Violent crime including shootings, assaults, and robberies is down in Detroit, Michigan. Fortunately, violent crime and overall crime have both decreased this month, with violent crime decreasing by 34% when compared to the previous month.
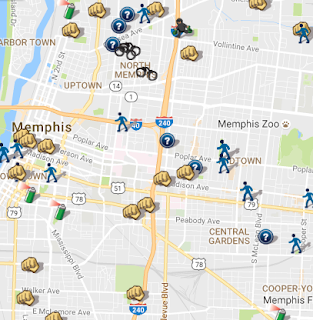
3. Memphis, TN
According to the reports SpotCrime receives from local police agencies,
crime overall in Memphis, Tennessee is currently up by 21% when compared to the previous month.
Property crime such as theft, vandalism, and burglary is up in Memphis, Tennessee. Unfortunately, property crime and overall crime have both increased this month, with property crime increasing by 11% when compared to the previous month.
Violent crime including shootings, assaults, and robberies is up in Memphis, Tennessee. Unfortunately, violent crime and overall crime have both increased this month, with violent crime increasing by 14% when compared to the previous month.
4. Baltimore, MD
According to the reports SpotCrime receives from local police agencies,
crime overall in Baltimore, Maryland is currently down by 14% when compared to the previous month.
Property crime such as theft, vandalism, and burglary is down in Baltimore, Maryland. Fortunately, property crime and overall crime have both decreased this month, with property crime decreasing by 20% when compared to the previous month.
Violent crime including shootings, assaults, and robberies is down in Baltimore, Maryland. Fortunately, violent crime and overall crime have both decreased this month, with violent crime decreasing by 25% when compared to the previous month.
5. Oakland, CA
According to the reports SpotCrime receives from local police agencies,
crime overall in Oakland, California is currently down by 10% when compared to the previous month.
Property crime such as theft, vandalism, and burglary is down in Oakland, California. Fortunately, property crime and overall crime have both decreased this month, with property crime decreasing by 9% when compared to the previous month.
Violent crime including shootings, assaults, and robberies is down in Oakland, California. Fortunately, violent crime and overall crime have both decreased this month, with violent crime decreasing by 7% when compared to the previous month.
6. (tie) Birmingham, AL
SpotCrime is not mapping much crime in
Birmingham, Alabama.
As a matter of fact, no one is mapping crime in Birmingham, AL.
Birmingham does not have an open data feed and they have not responded to FOIA requests for crime incident information.
Because of this, we don’t have an analysis for you.
6. (tie) Milwaukee, WI
According to the reports SpotCrime receives from local police agencies,
crime overall in Milwaukee, Wisconsin is currently up by 9% when compared to the previous month.
Property crime such as theft, vandalism, and burglary is up in Milwaukee, Wisconsin. Unfortunately, property crime and overall crime have both increased this month, with property crime increasing by 17% when compared to the previous month.
Violent crime including shootings, assaults, and robberies is up in Milwaukee, Wisconsin. Unfortunately, violent crime and overall crime have both increased this month, with violent crime increasing by 9% when compared to the previous month.
7. (tie) Kansas City, MO
According to the reports SpotCrime receives from local police agencies,
crime overall in Kansas City, Missouri is currently down by 24% when compared to the previous month.
Property crime such as theft, vandalism, and burglary is down in Kansas City, Missouri. Fortunately, property crime and overall crime have both decreased this month, with property crime decreasing by 26% when compared to the previous month.
Violent crime including shootings, assaults, and robberies is down in Kansas City, Missouri. Fortunately, violent crime and overall crime have both decreased this month, with violent crime decreasing by 18% when compared to the previous month.
It’s counterpart,
Kansas City, KS was in a top 10 list once. They took their data feed offline in April and it has yet to be restored.
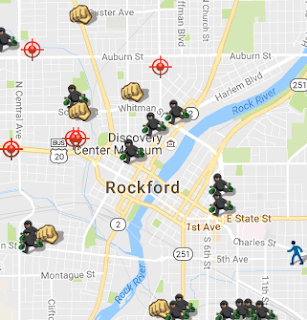
7. (tie) Rockford, IL
This is another city where we have had an incredibly hard time getting the police department to be transparent with crime data.
We have no analysis for you, but we do try to map breaking news in
Rockford for our Rockford subscribers.
8. Tukwila, WA
According to the reports SpotCrime receives from local police agencies,
crime overall in Tukwila, Washington is currently down by 92% when compared to the previous month.
Property crime such as theft, vandalism, and burglary is down in Tukwila, Washington. Fortunately, property crime and overall crime have both decreased this month, with property crime decreasing by 94% when compared to the previous month.
Violent crime including shootings, assaults, and robberies is down in Tukwila, Washington. Fortunately, violent crime and overall crime have both decreased this month, with violent crime decreasing by 97% when compared to the previous month.
9. (tie) Camden, NJ
Camden, NJ police merged with the Camden County, NJ police recently. And alas, another area where it is a 'dead zone' for access to public crime information.
Camden County Police are listed as participating on the
White House Police Data Initiative since the creation of the PDI, however, they have Camden County has yet to release any crime incident data to the public.
We do not have an analysis for you.
9. (tie) Myrtle Beach, SC
According to the reports SpotCrime receives from local police agencies,
crime overall in Myrtle Beach, South Carolina is currently down by 17% when compared to the previous month.
Property crime such as theft, vandalism, and burglary is down in Myrtle Beach, South Carolina. Fortunately, property crime and overall crime have both decreased this month, with property crime decreasing by 13% when compared to the previous month.
Violent crime including shootings, assaults, and robberies is down in Myrtle Beach, South Carolina. Fortunately, violent crime and overall crime have both decreased this month, with violent crime decreasing by 22% when compared to the previous month.
10. Emeryville, CA
According to the reports SpotCrime receives from local police agencies,
crime overall in Emeryville, California is currently down by 10% when compared to the previous month.
Property crime such as theft, vandalism, and burglary is down in Emeryville, California. Fortunately, property crime and overall crime have both decreased this month, with property crime decreasing by 16% when compared to the previous month.
Violent crime including shootings, assaults, and robberies is up in Emeryville, California. Even with a violent crime increase of 11%, overall crime is still down 10% from the previous month.
Were there any cities you were expecting to be on this list?
Let us know!
Want to stay aware of crime in your neighborhood?
Sign up to receive free daily crime alerts directly to your inbox.


Add a comment